Delivering a Scalable UX Vision for Value-Based Care Analytics
Providing real-time performance scorecards through Aledade's app gave practices on-demand access to critical data, enabling them to track progress and optimize value-based care outcomes. Following a successful beta launch with 60 practices, this project aimed to expand the rollout to Aledade's core customer base of 1,500 practices.
My Role
- UX Strategy
- User Research
- UX/UI Design
Team
- Product Manager
- Business Partners
- Shared Engineering Team
Duration
- 6 Months
Faster Insights with AI-Powered Research
We used AI-driven analysis to quickly process large amounts of qualitative and quantitative research. Instead of manually sorting through interviews and survey responses, AI helped us identify key themes, spot inconsistencies, and uncover patterns that might have been missed.
Turning Feedback into Strategic Insights
Our research with Aledade's Practice Transformation Specialists (PTS) gave us a clearer picture of how practices use performance data. Using AI-powered transcription and topic modeling, we analyzed conversations and beta feedback across different markets to find common pain points and opportunities. These insights helped us refine our approach so that real-world challenges and user needs shaped our solutions.
Transforming Friction into Opportunities
Insights matter only when they drive action. By mapping pain points across the entire performance journey for both practices and Aledade's teams, we identified key friction points and opportunities for improvement. Then we prioritized solutions based on feasibility and impact, making sure our recommendations were practical and useful for the people relying on the data every day.
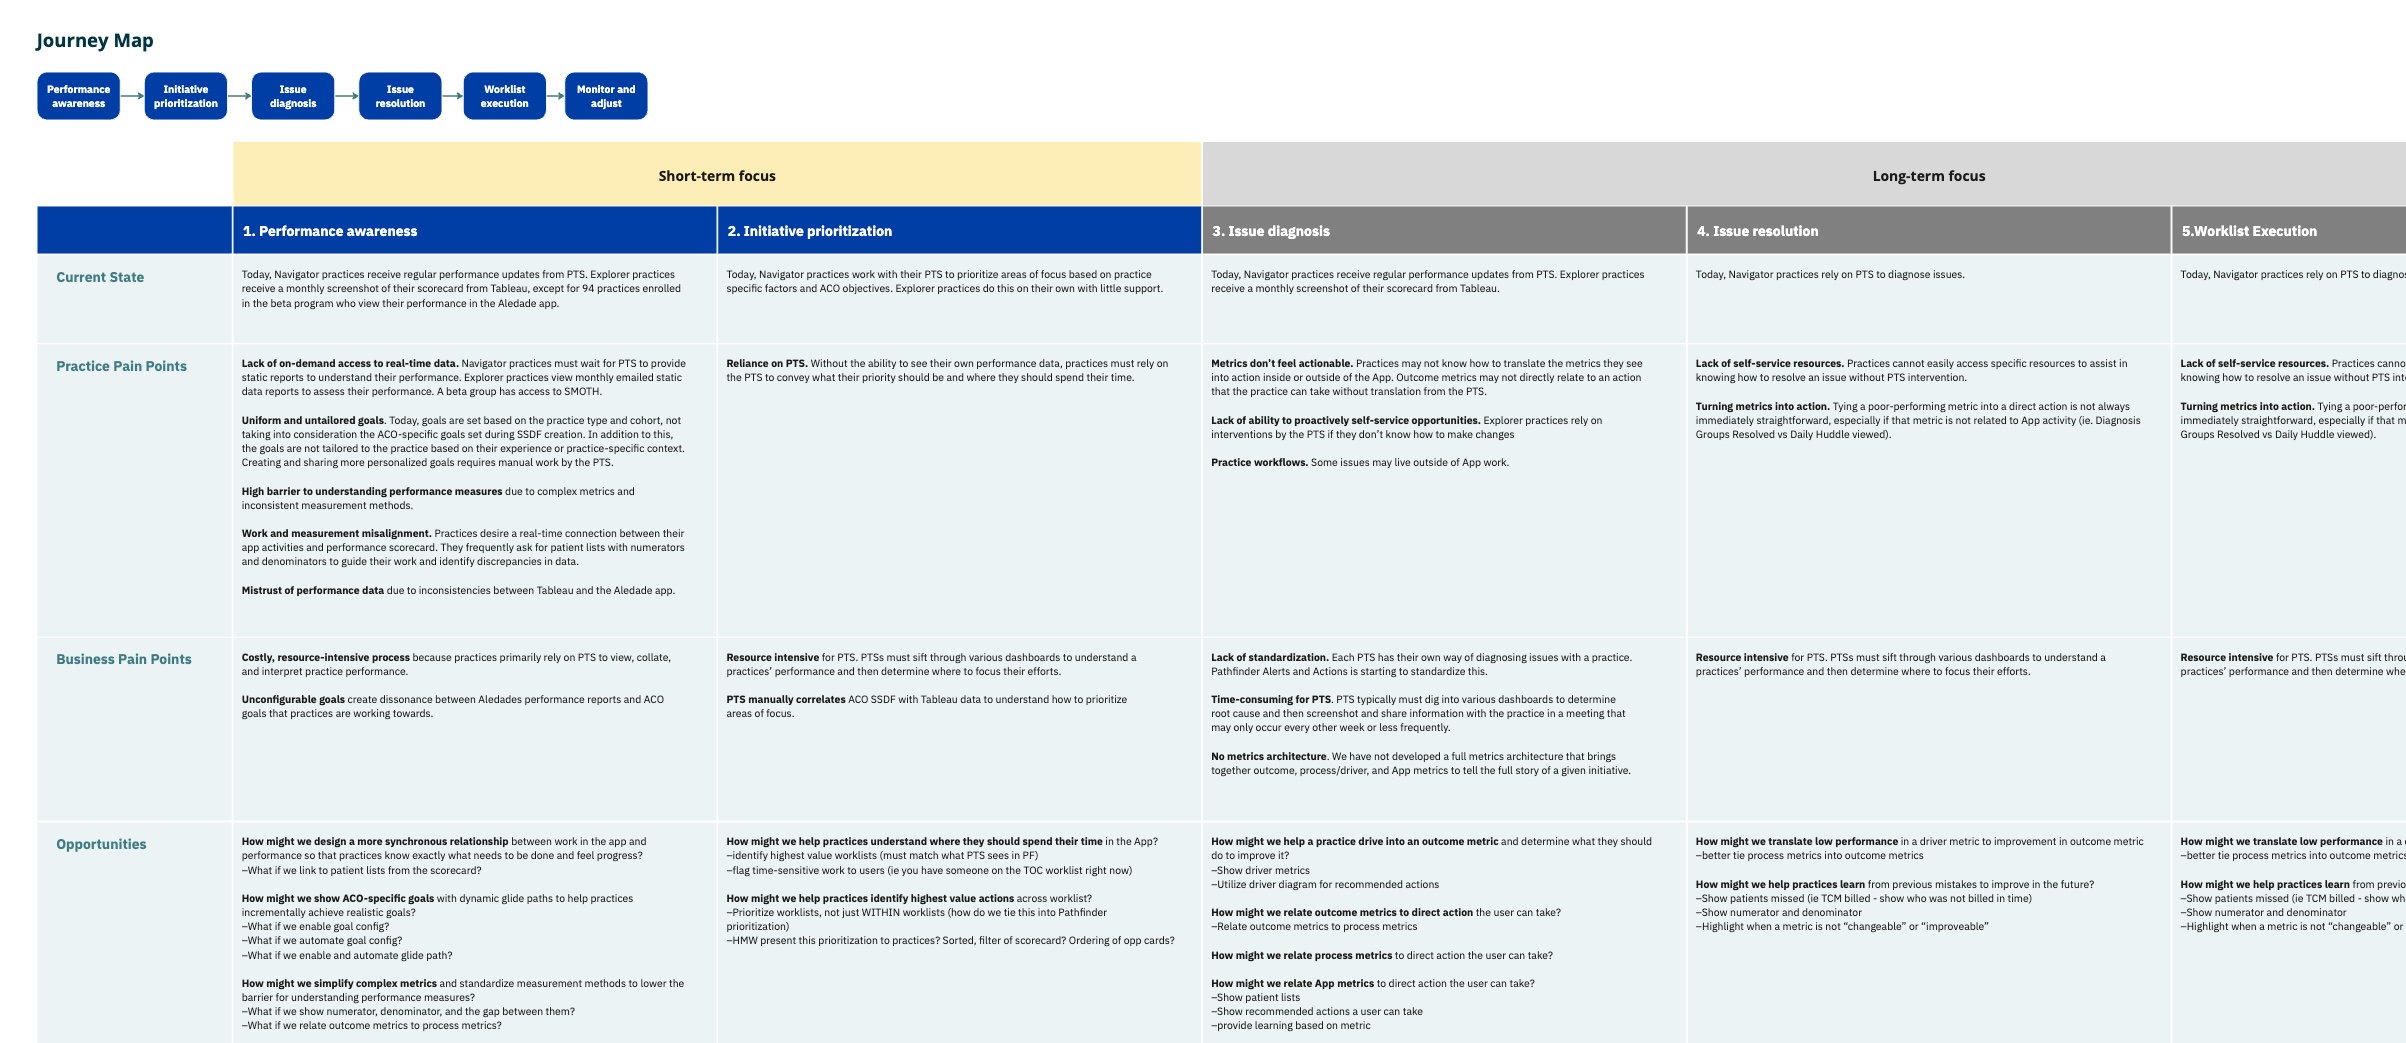
Delivering Key UX/UI Enhancements for Beta Expansion to 1,500 Practices
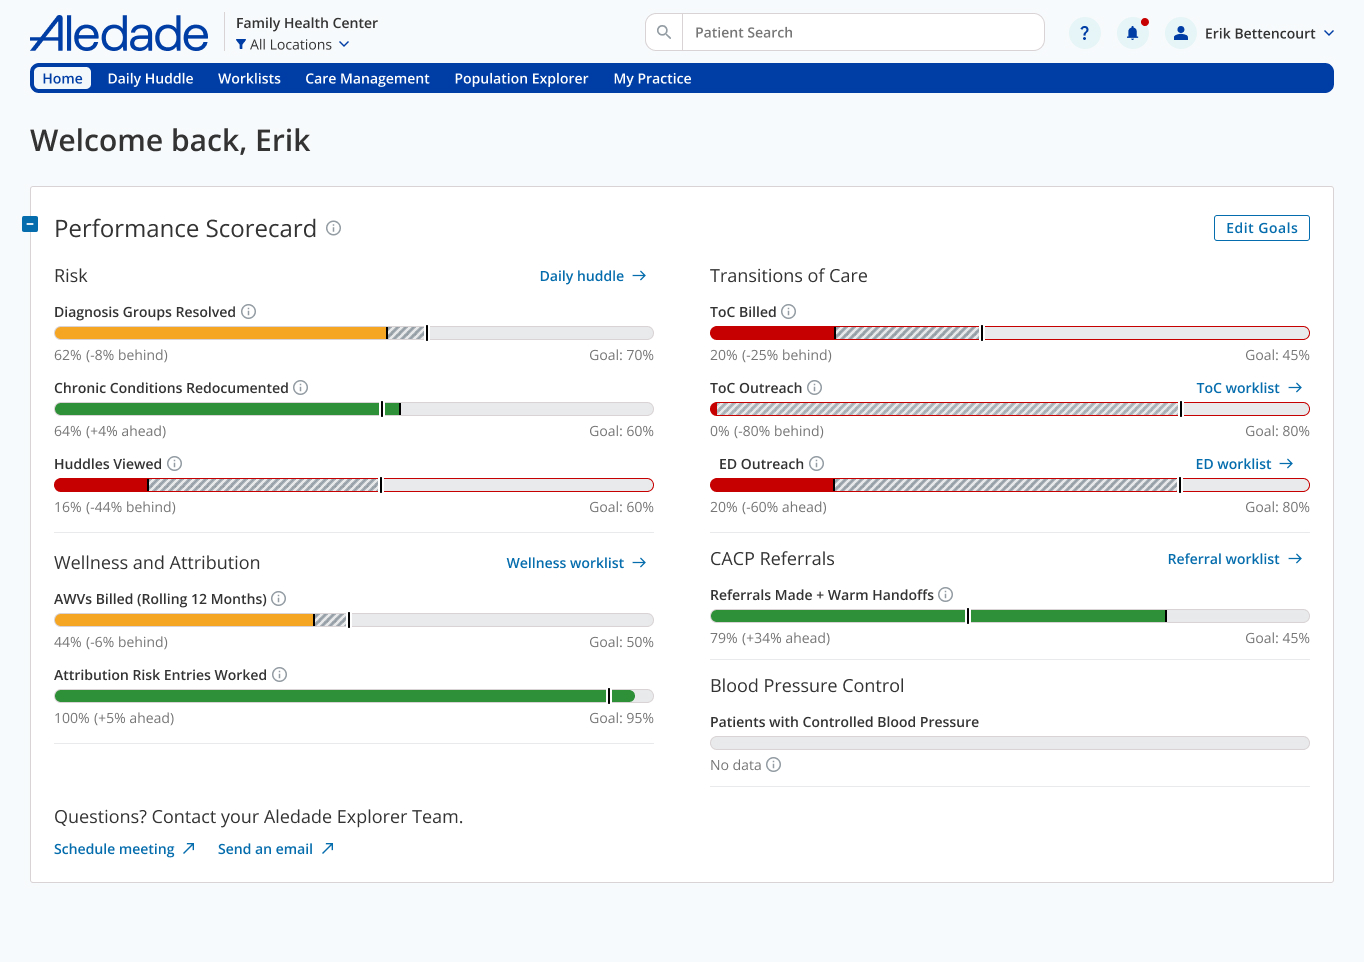
To scale the beta from 60 to 1,500 practices, we focused on three high-impact UX improvements informed by our research. These enhancements streamlined scorecard usability and seamlessly integrated with existing goal-setting workflows led by in-person coaches.
UX Showcase: Goal Configuration Explorations
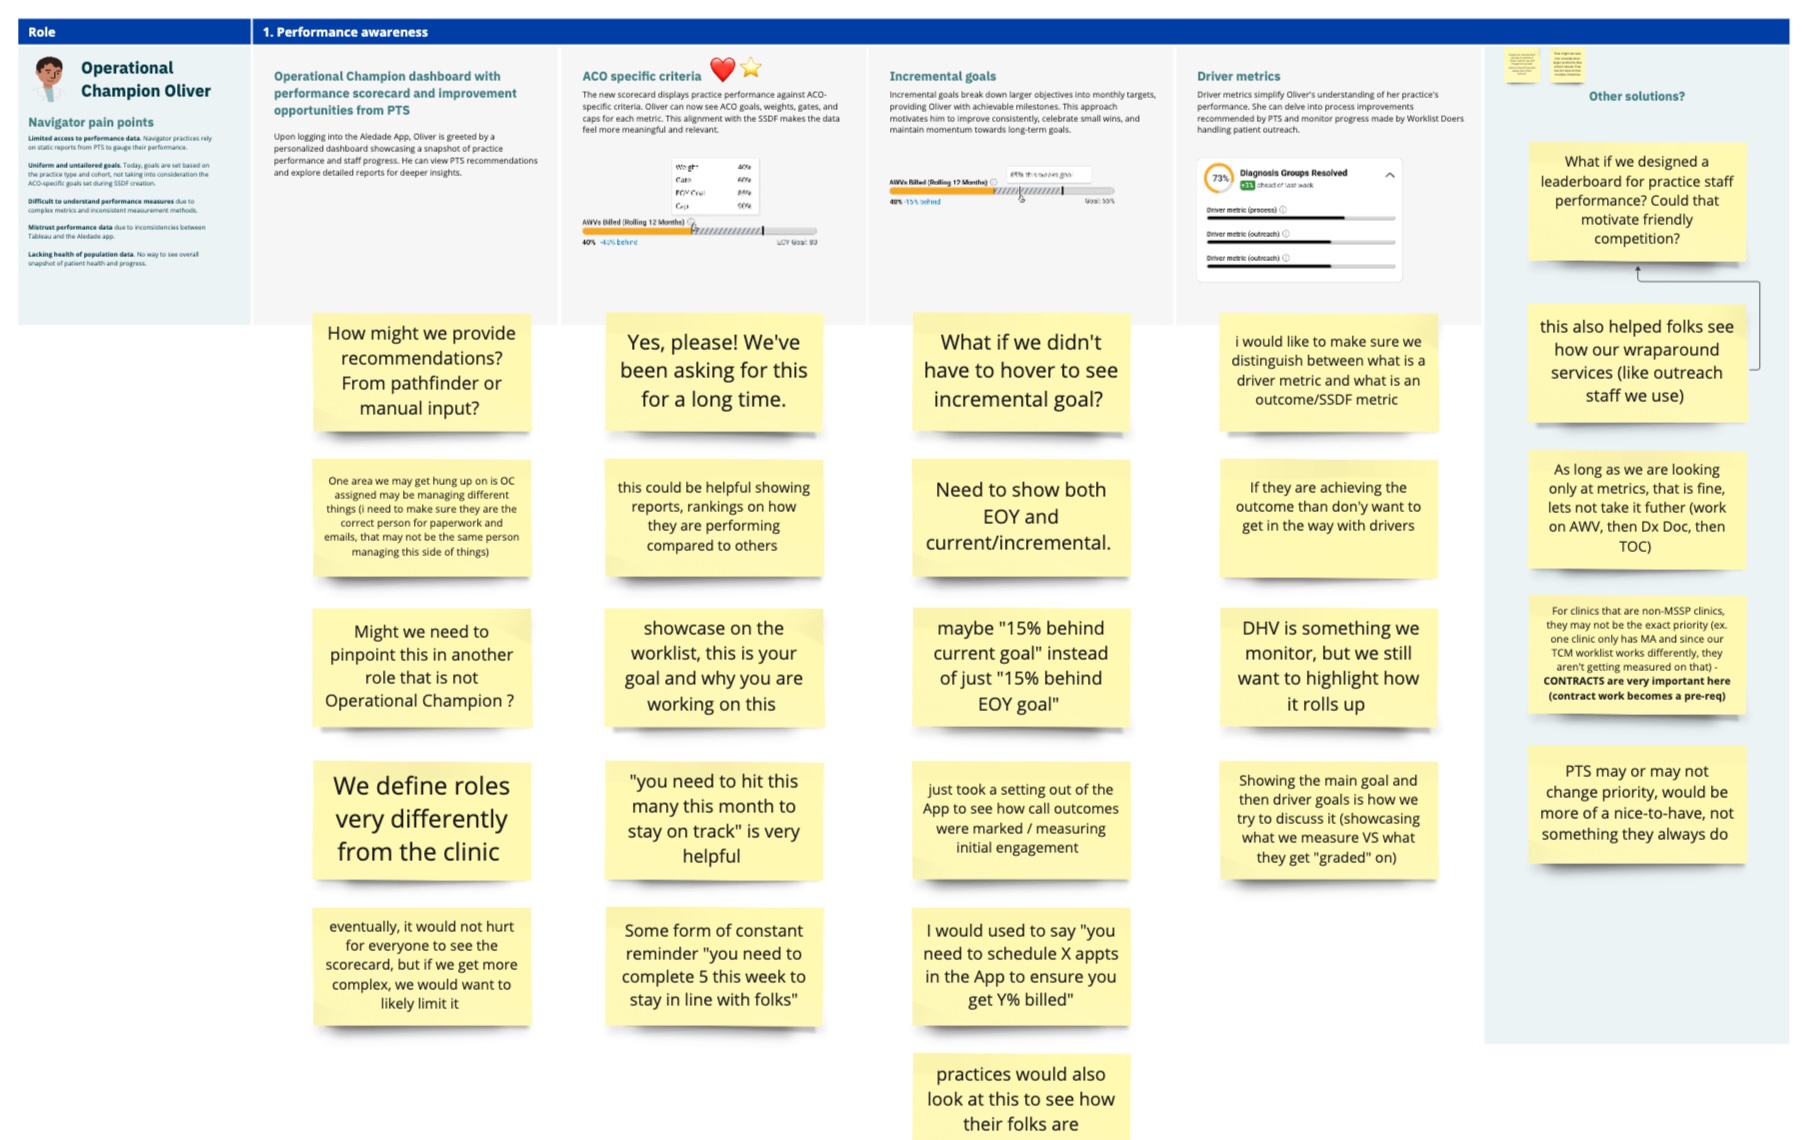
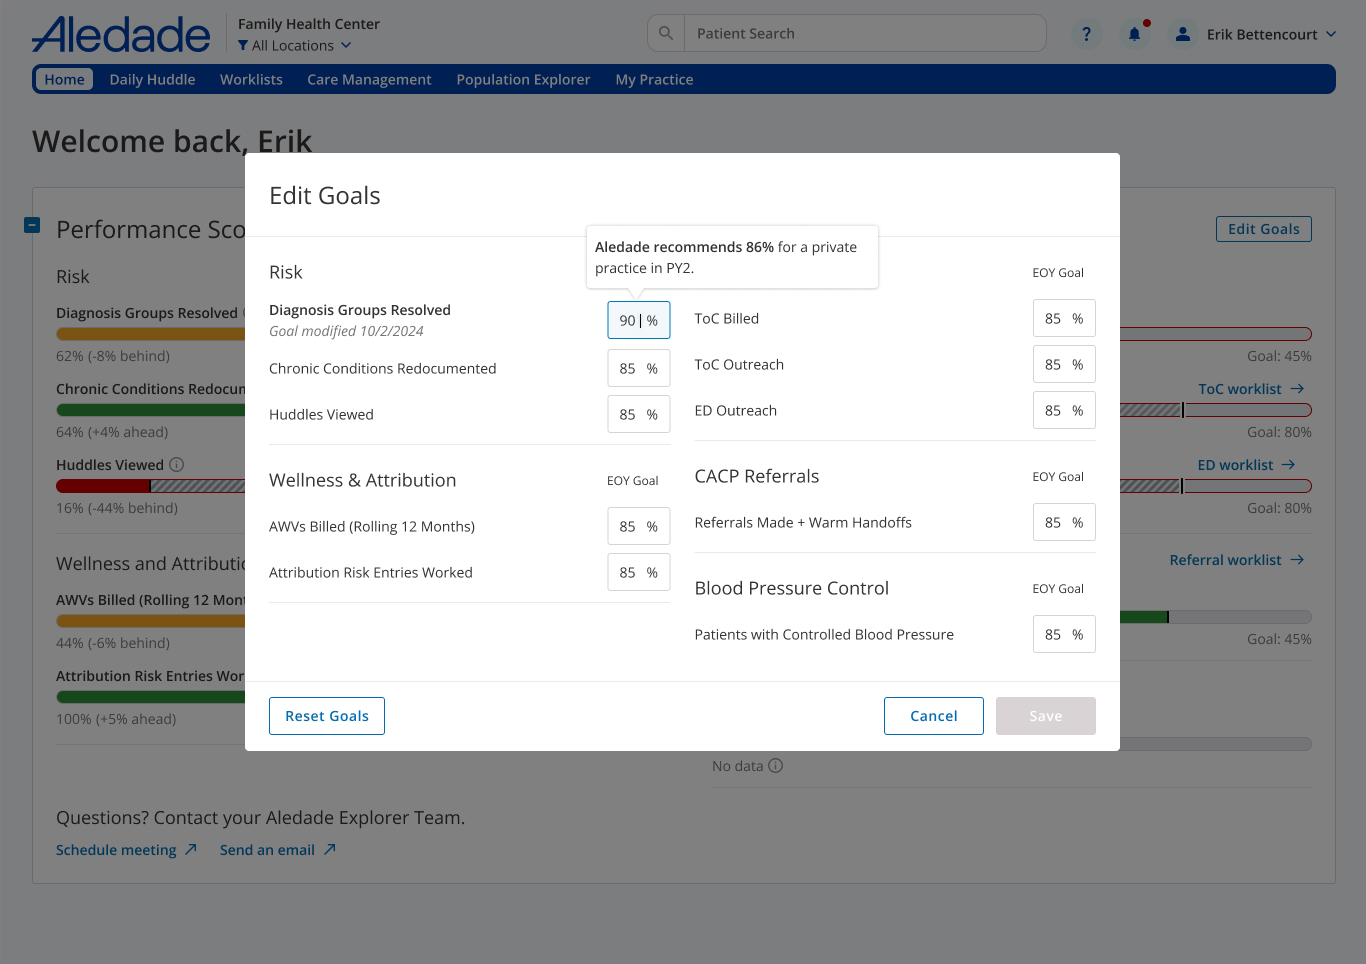
For the Navigator practice rollout, goal configuration was a key focus, but the right solution wasn't immediately clear. Our research showed that goals needed to adapt dynamically—shifting from quarterly to bi-weekly based on practice size, specialty, and experience with value-based care.
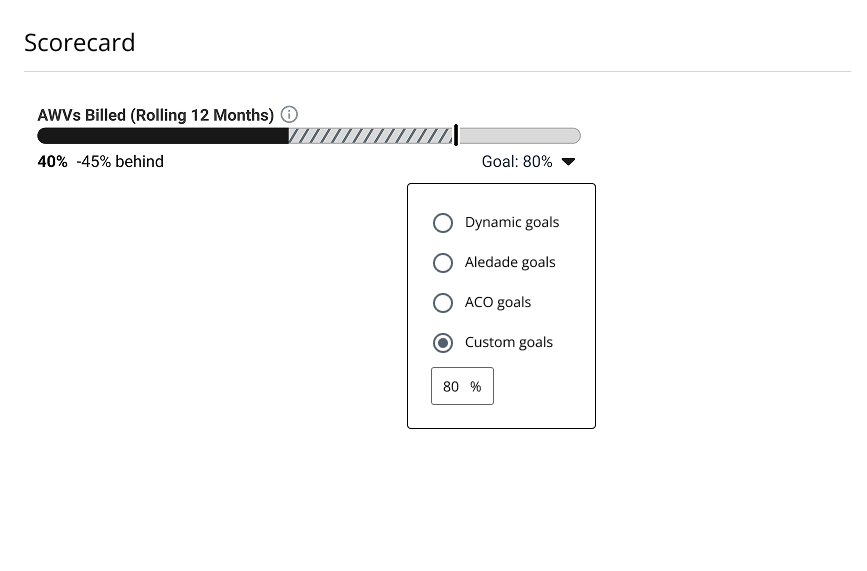
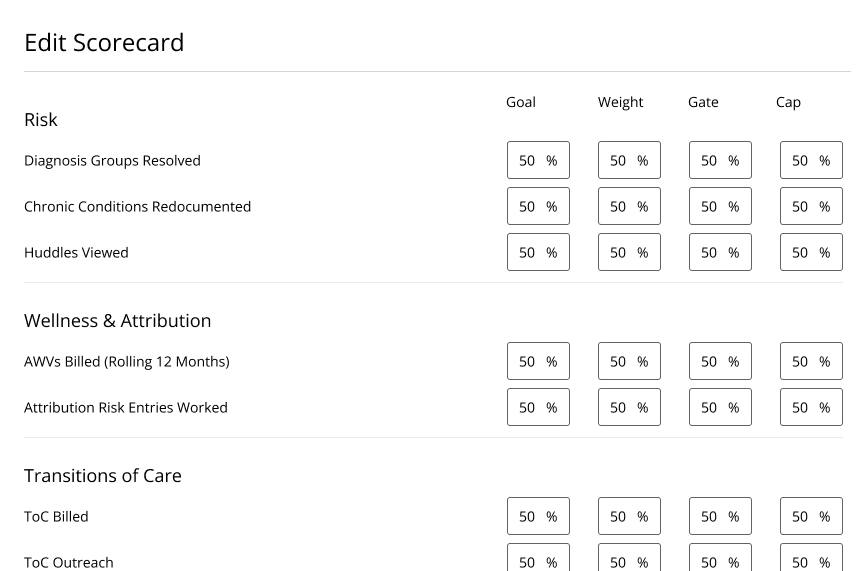
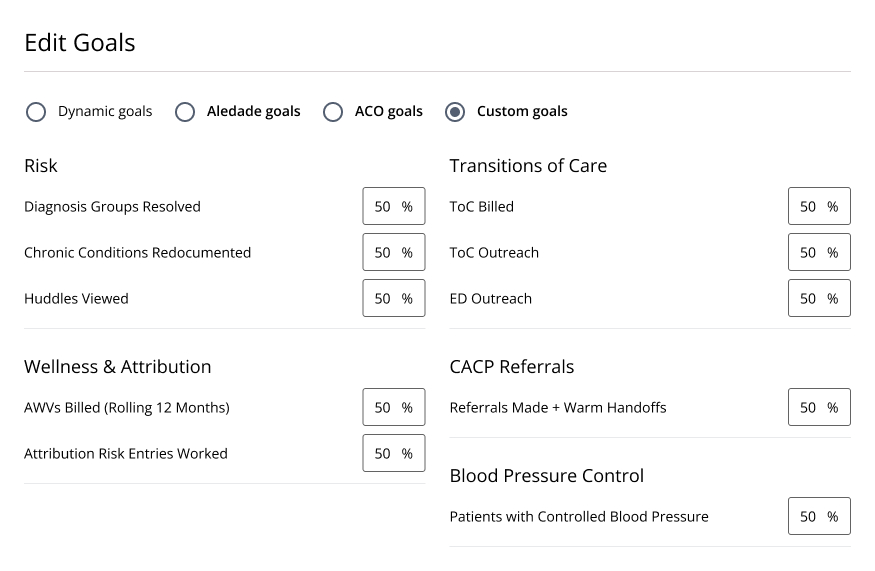
Weekly Co-Design: Bridging Design and Real-World Needs
To ensure goal configuration met the needs of Navigator practices, we held weekly co-design sessions with Practice Transformation Specialists (PTS). These sessions helped us refine workflows, explore long-term opportunities, and incorporate cross-disciplinary feedback—bridging research insights with practical implementation.
Balancing UX Best Practices with Engineering Constraints
With a shared engineering team and tight development cycles, we focused on delivering the highest-impact UX improvements without overloading resources. This meant making strategic trade-offs—prioritizing core functionality while ensuring a solid foundation for future enhancements.
Shaping the Future of Practice Performance
With foundational improvements in place, we explored a long-term vision for the scorecard, evolving it from static tracking to a dynamic, personalized, and motivational tool. Through weekly co-design sessions, testing with 10 practices, and strategic prioritization, we mapped a roadmap balancing essentials with transformative innovations for lasting impact.
Future Journey Mapping: Designing for Diverse Needs
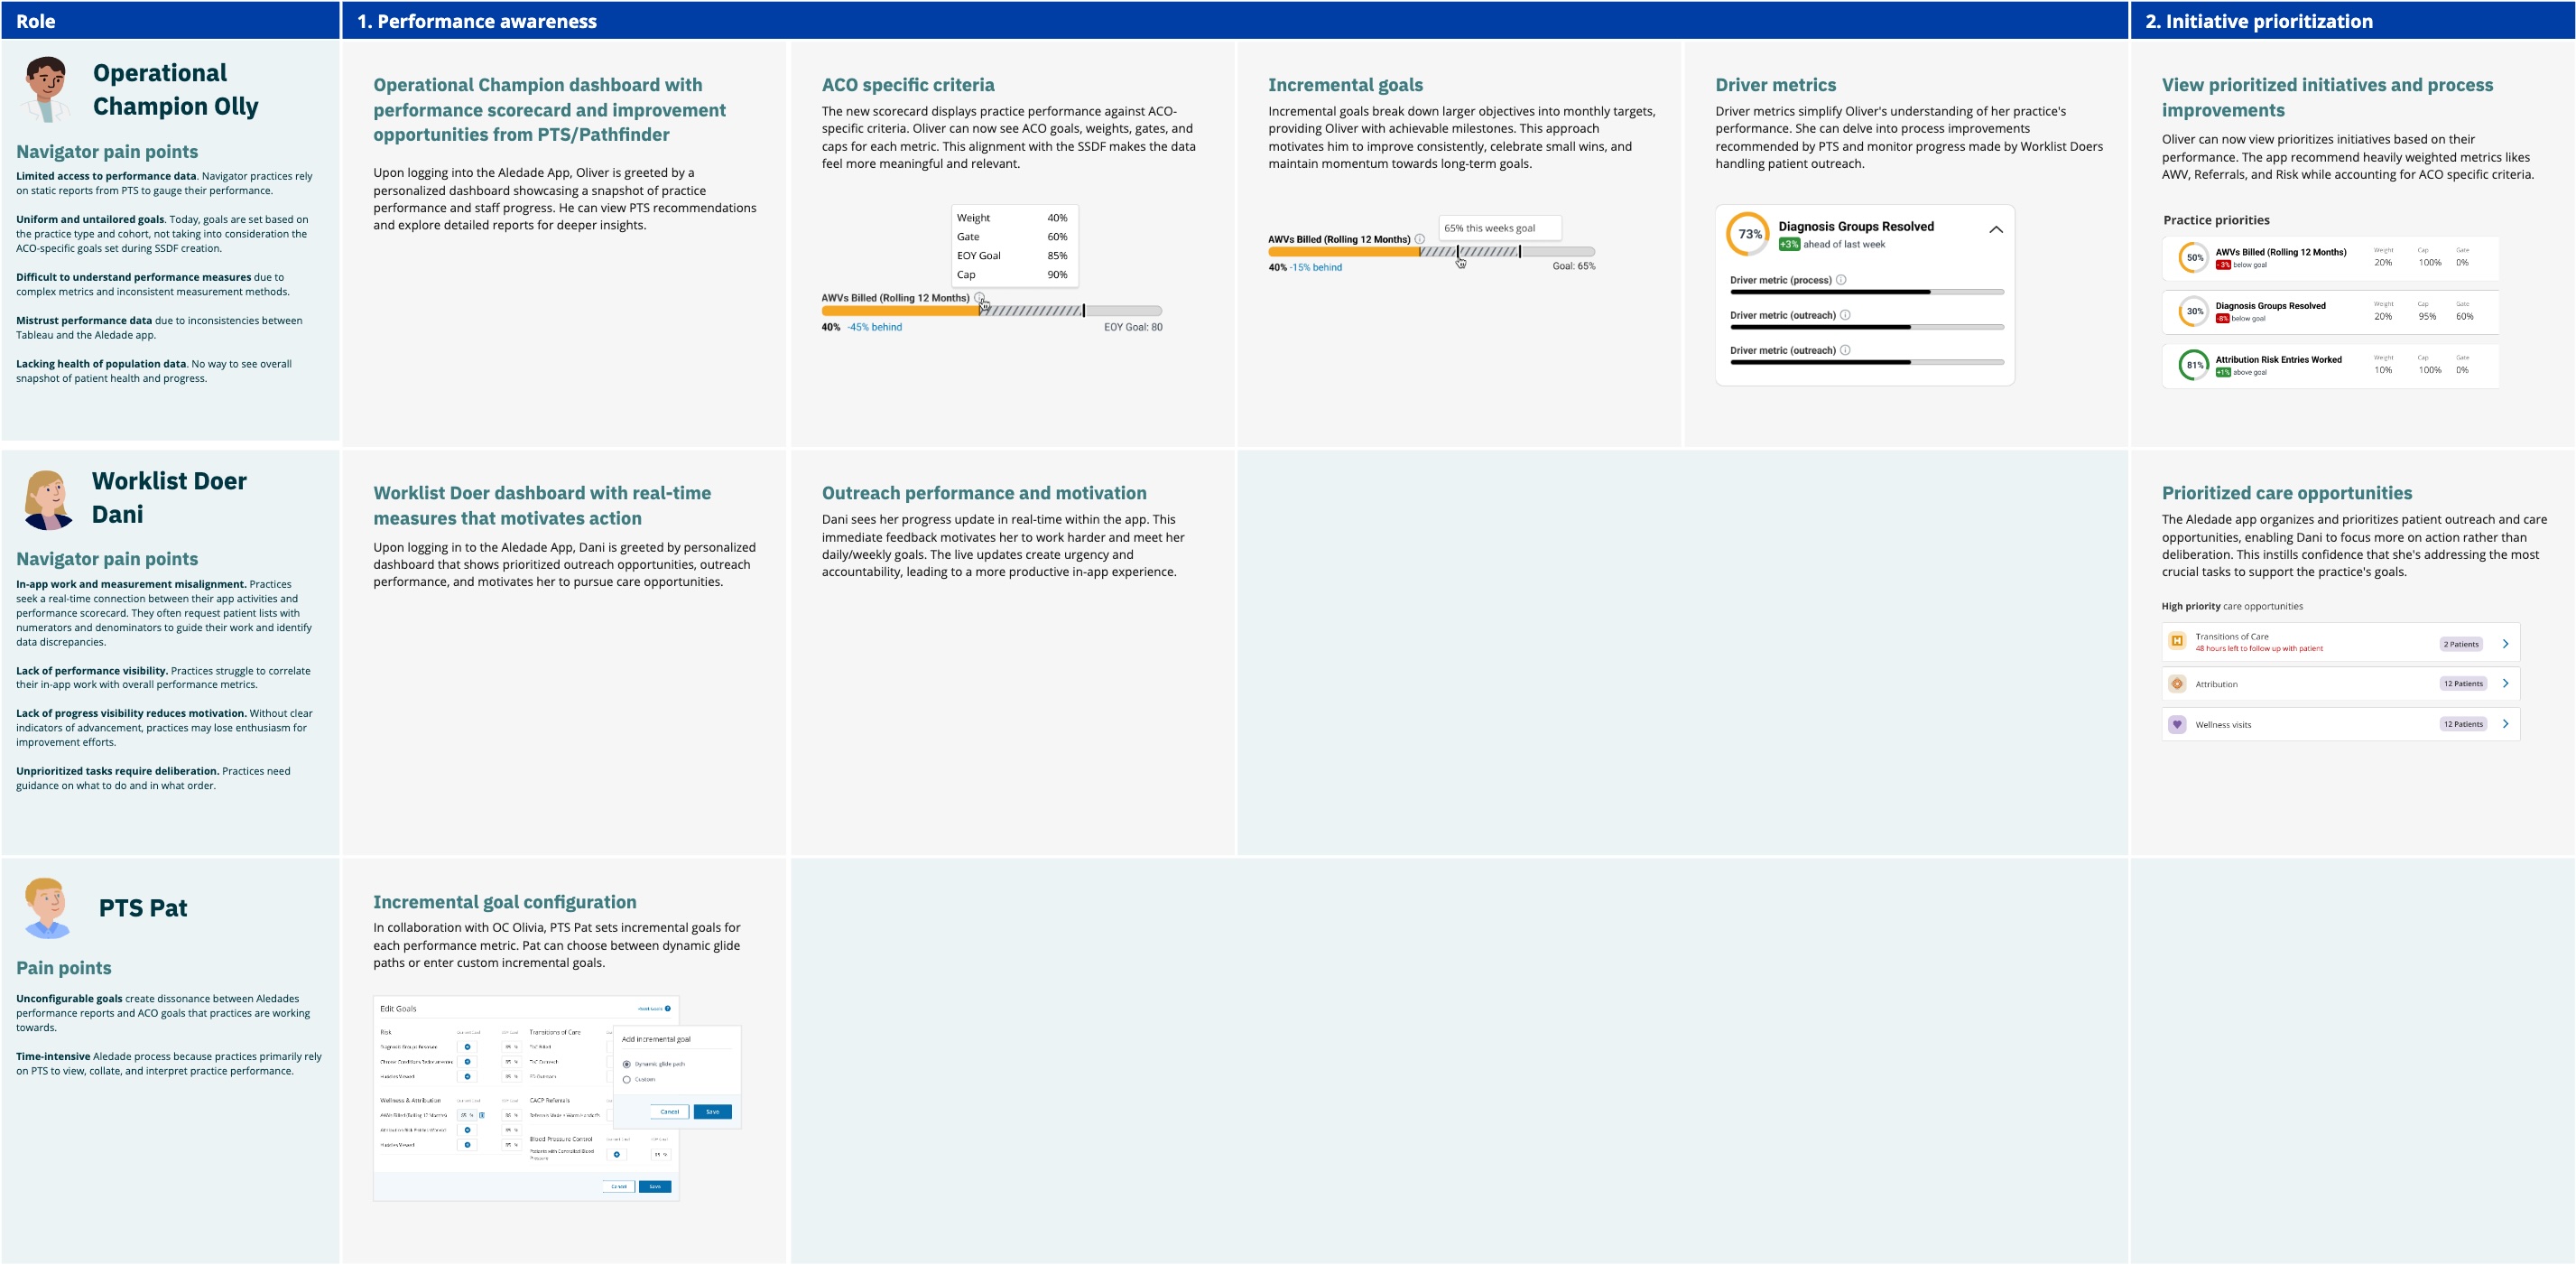
We mapped the performance journey across three practice personas based on their confidence in using performance data, allowing us to identify key friction points and tailor solutions to their maturity. New practices needed simplified data and guided support to navigate value-based care metrics, mid-level practices required incremental goal-setting and clearer progress tracking to stay engaged, and advanced practices sought benchmarking tools and predictive insights to fine-tune performance.
Testing Assumptions and Sharpening the Vision
To ensure our solutions addressed real user needs, we conducted a comprehensive mixed-method research study with 10 practices, combining qualitative insights with AI-powered data analysis. Using AI-driven sentiment analysis, we systematically examined user feedback, uncovering recurring themes, pain points, and opportunities to enhance the scorecard experience. This iterative approach allowed us to validate assumptions and evaluate concepts.
Communicating the Vision: Research-Backed Storytelling
To bring our research insights and concepts to life, we crafted user narratives, vignettes, and low-fidelity visualizations, transforming raw data into compelling, actionable artifacts. These served as alignment tools, enabling stakeholders to visualize the user experience, validate design decisions, and stay focused on the vision.
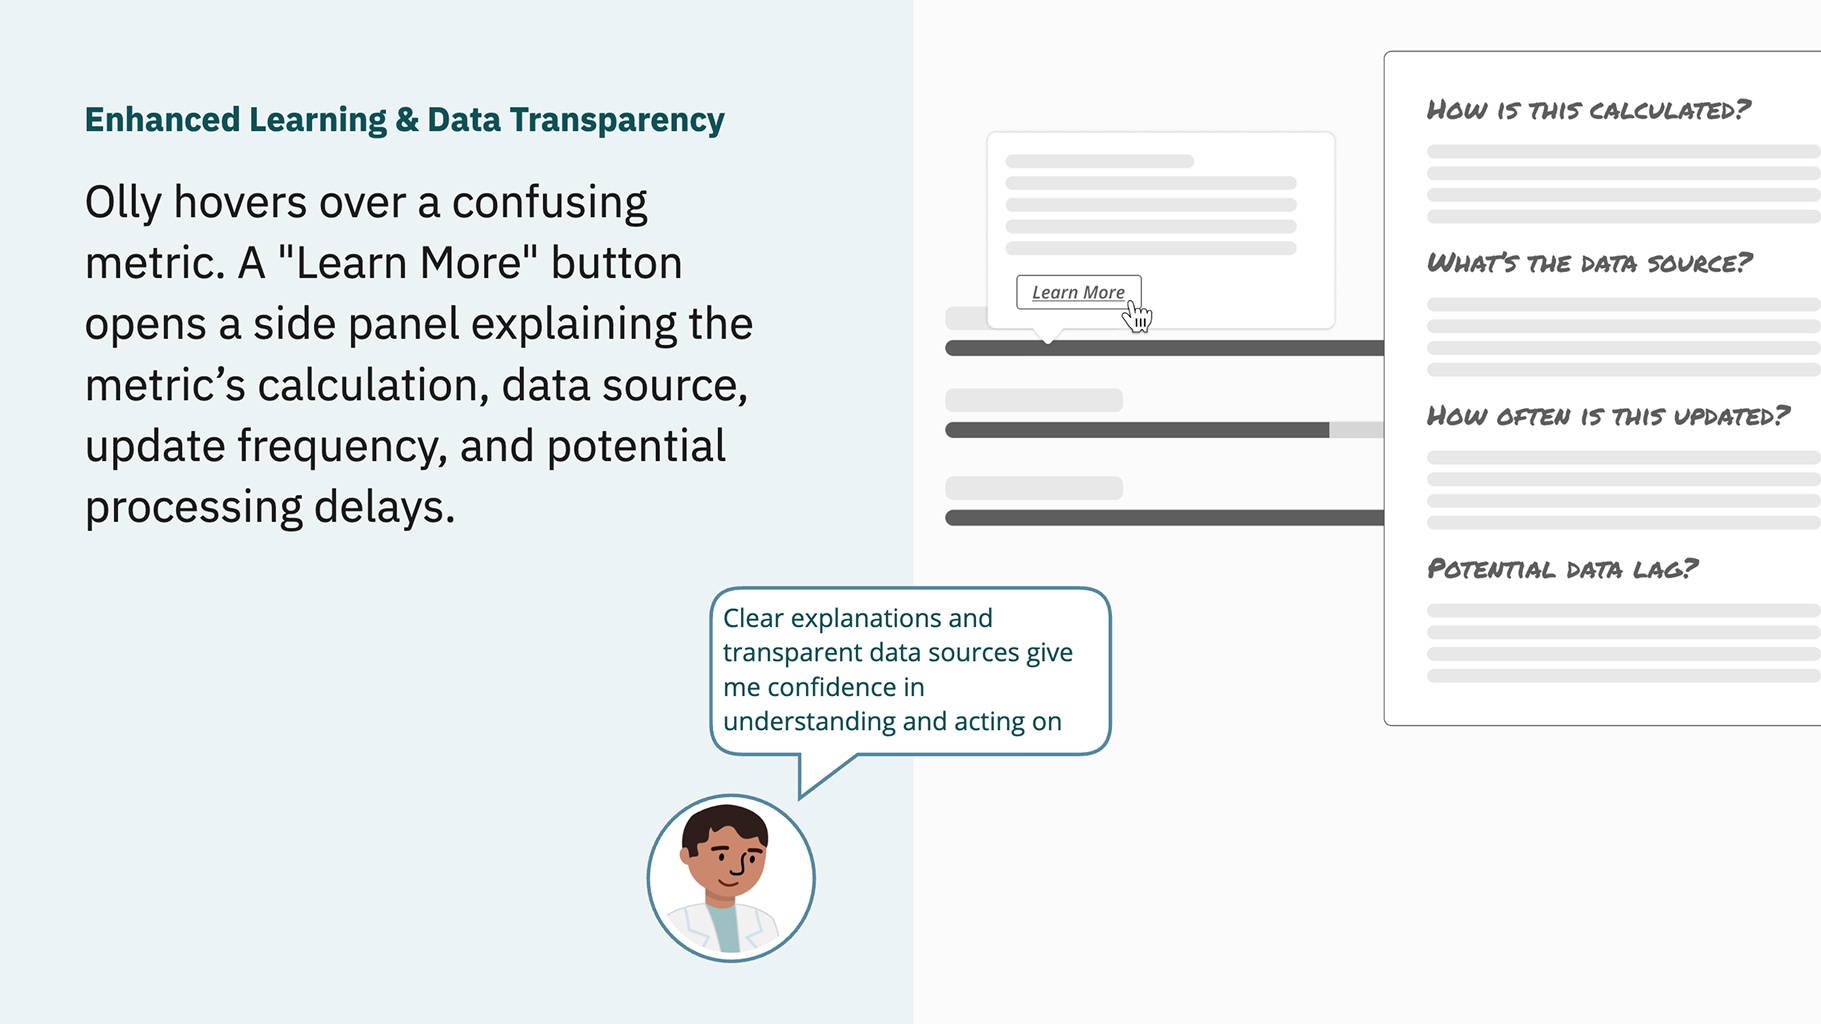
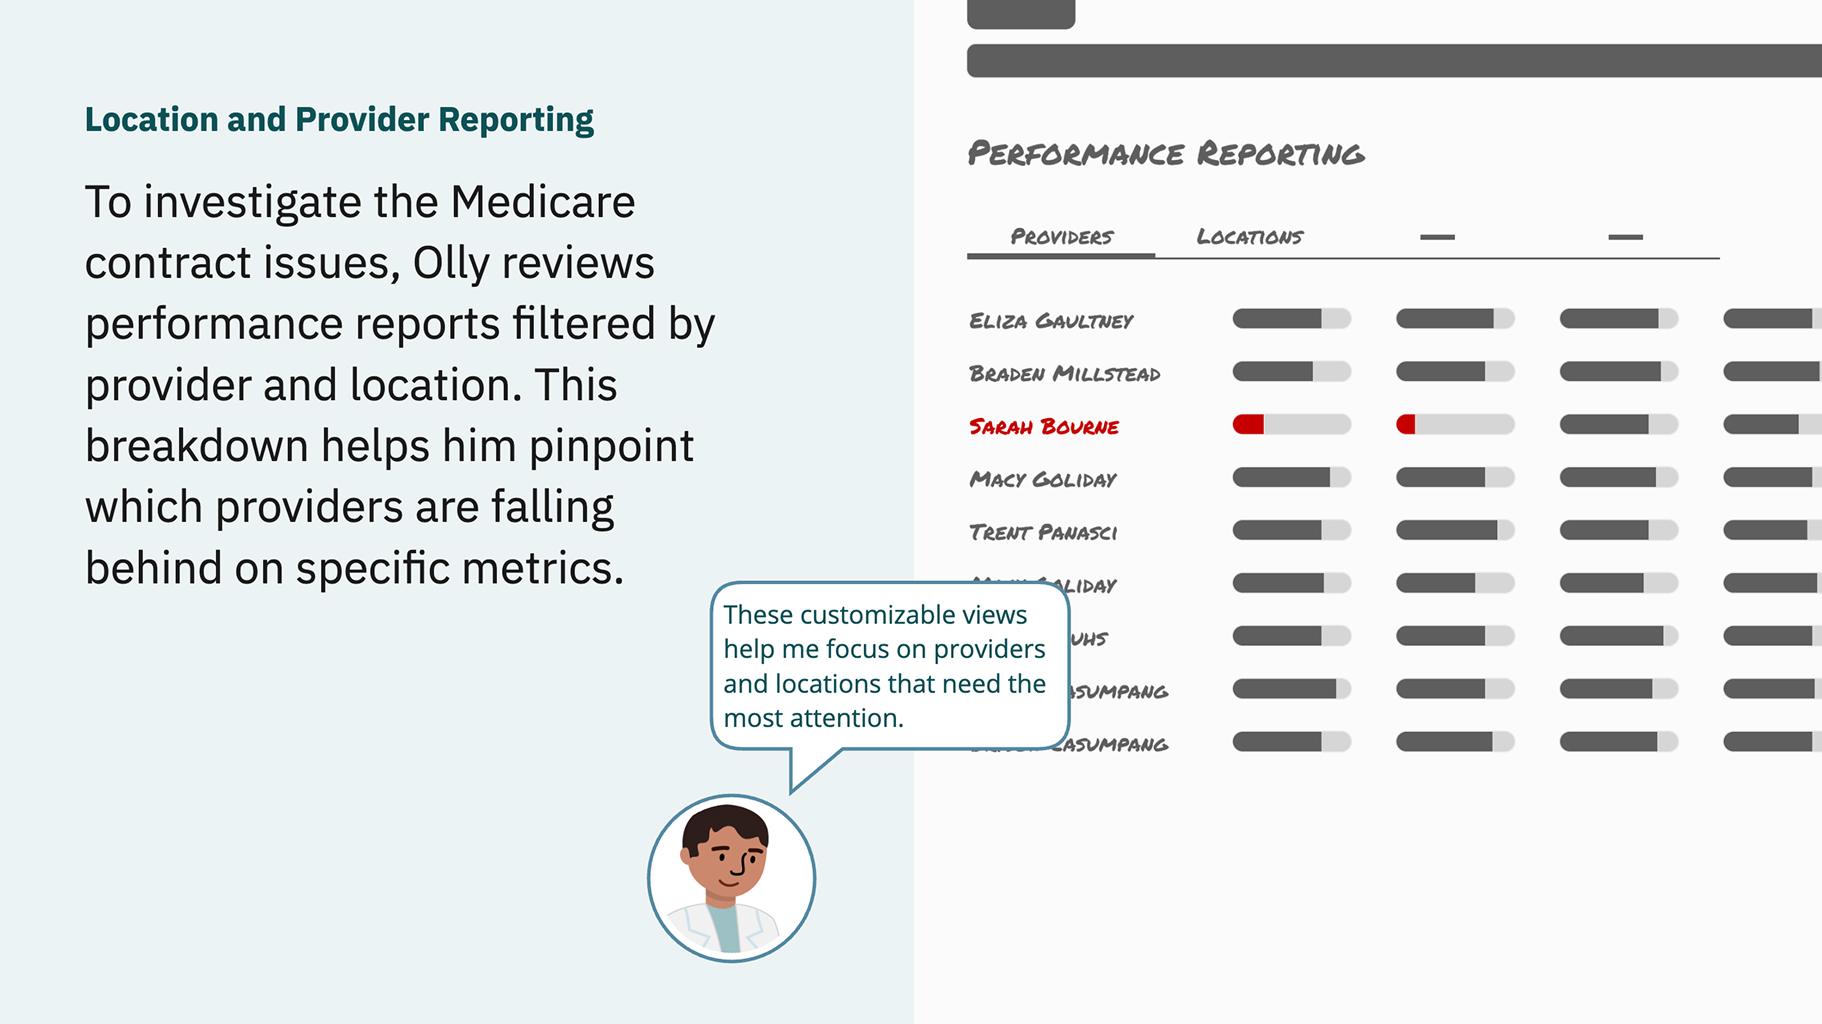
To ensure thoughtful prioritization, we applied the KANO model, categorizing features based on their impact on customer satisfaction and business goals. For each proposed enhancement, we developed detailed vignettes that combined user stories, direct quotes, and visual concepts, making abstract ideas more tangible and grounding design exploration in real-world context.
Advancing Value-Based Care Delivery
Expanded Beta Rollout to 400 Practices
We identified key requirements, delivered a goal configuration UI, and expanded the enhanced scorecard to 400 Navigator practices across UT, AZ, NV, and NM.
Aligned Business Goals with User Needs
Through validated hypotheses, we aligned the solution with practice workflows and business objectives, prioritizing usability and high-value improvements to drive shared savings for all.
Delivered a Strategic UX Roadmap
We developed a 12-16 month roadmap focused on improving scorecard usability, driving motivation through actionable insights, and supporting long-term value-based care success.
Increased User Engagement
Enhancements to goal configuration and drill-down functionality made it easier for practices to access and act on their performance data, leading to an estimated 5–10% increase in click-through rate.
